
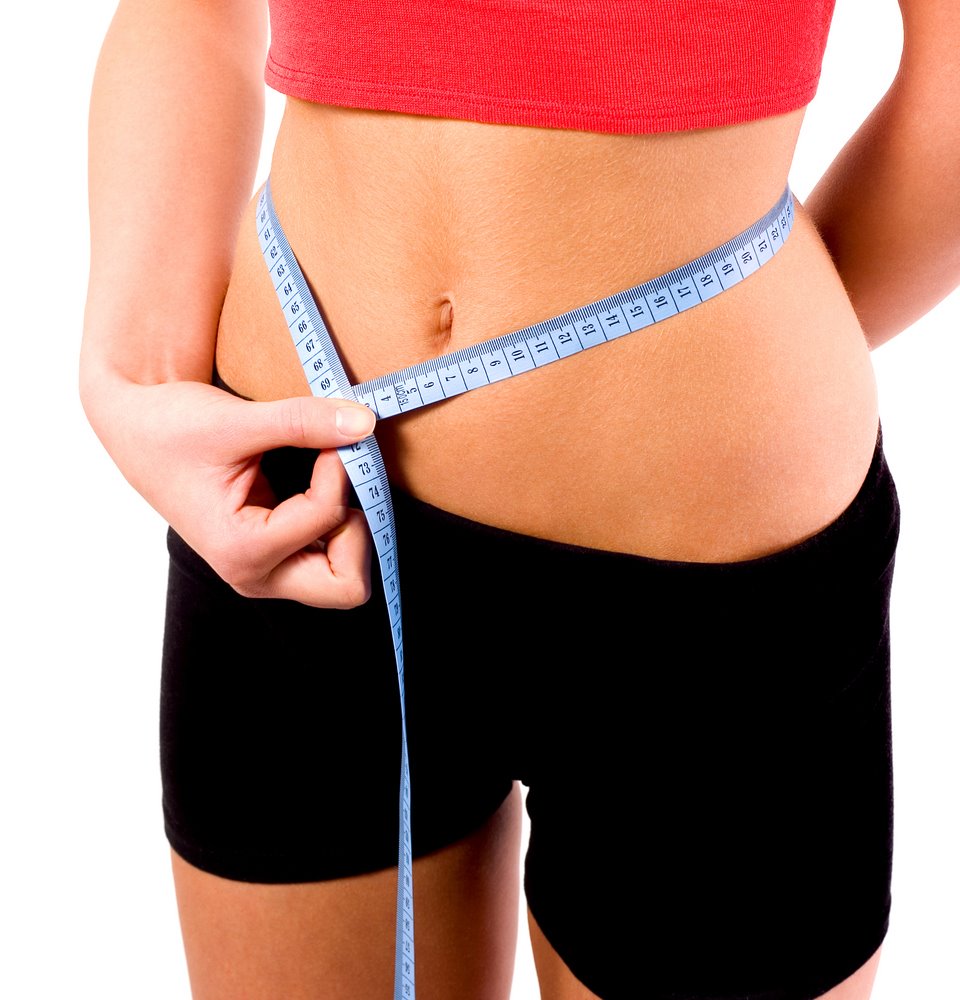
Waist-to-height ratio is your waist measurement divided by your height, in the same units. Below 0.5 is the conventional healthy range, which is why the shorthand is “keep your waist to less than half your height.” It performs better than BMI as a simple screen for cardiometabolic risk factors, mainly because it captures where fat sits rather than only how much a body weighs. It is a screening number, not a diagnosis, and it has real limits.
The version of this article that stood here overstated all of that. It said a high ratio meant you should “expect to dramatically shorten your lifespan” and that keeping the waist small could “prevent the onset of” diabetes, heart disease and stroke. Neither claim is supportable, and the correction is below.
Where the 0.5 boundary came from
The ratio was proposed independently in Japan and the UK during the 1990s, and both groups landed on 0.5 as the point above which risk appeared to rise. Ashwell and Cole formalized it in 1996 as a proxy for central adiposity, validated against abdominal imaging.
The underlying idea is older still. Jean Vague observed in the 1940s and 1950s that fat carried around the abdomen behaved differently from fat carried on the hips and thighs. BMI cannot see that distinction at all. Two people of identical height and weight can have very different amounts of fat around the organs, and BMI returns the same number for both.
The boundary held up when it was tested. A systematic review by Browning, Hsieh and Ashwell covering 78 studies across 14 countries (including European, Asian and Central American populations) found a weighted mean boundary value of 0.50 for both men and women (Nutrition Research Reviews, 2010).
What the comparative evidence found
The main meta-analysis is Ashwell, Gunn and Gibson in Obesity Reviews in 2012, pooling roughly 300,000 adults across multiple ethnic groups. Compared with BMI, waist circumference improved discrimination for cardiometabolic risk factors by about 3 percent and waist-to-height ratio by 4 to 5 percent. Waist-to-height ratio outperformed waist circumference alone for diabetes, hypertension and cardiovascular outcomes in both sexes.
Those are modest margins. The more striking finding is about who BMI misses. Ashwell and Gibson analyzed Health Survey for England data and reported that about 31 percent of adults sitting inside the healthy BMI range of 18.5 to 25 nevertheless had a waist-to-height ratio of 0.5 or above, 36 percent of men and 27 percent of women (Proceedings of the Nutrition Society). Roughly a third of people told their weight is fine by BMI have a central fat distribution the measure never looked for.
In the Browning review, pooled discrimination for cardiovascular disease and diabetes gave a mean area under the curve of 0.704 for waist-to-height ratio against 0.671 for BMI. Better, and still a long way from a definitive test.
What NICE and the Lancet Commission now recommend
The UK’s National Institute for Health and Care Excellence adopted the measure formally. Its guidance on overweight and obesity management recommends that adults with a BMI below 35 measure and use waist-to-height ratio alongside BMI as a practical estimate of central adiposity, and extends the same categories to children and young people aged five and over.
| Waist-to-height ratio | NICE category |
|---|---|
| 0.4 to 0.49 | Healthy central adiposity, no increased health risks |
| 0.5 to 0.59 | Increased central adiposity, increased health risks |
| 0.6 or more | High central adiposity, further increased health risks |
NICE states these categories apply across both sexes and all ethnicities, including adults with high muscle mass, and does not recommend the ratio above a BMI of 35, where central adiposity can be assumed.
Internationally, the direction is the same. The Lancet Commission on clinical obesity, published in Lancet Diabetes and Endocrinology in 2025, proposed that obesity should not be diagnosed on BMI alone but should require at least one measure of fat distribution (waist circumference, waist-to-hip ratio or waist-to-height ratio) alongside it.
How to measure it, because most people do not
The measurement is where this falls apart in practice, and the reason is that two standard protocols exist and they do not give the same answer.
NICE and the World Health Organization use the midpoint between the bottom of the lowest rib and the top of the hip bone. The NHANES protocol used in US surveys measures at the level of the top of the right iliac crest, which is lower on most bodies and typically returns a larger number (NHLBI clinical guidelines). Neither is wrong; they are different instruments, and comparing a reading taken one way against a threshold derived the other way introduces error.
For the NICE thresholds above, the method that matches them is:
- Measure against bare skin or a single thin layer, not over clothing.
- Stand upright, feet together, arms relaxed at your sides.
- Find the midpoint between the bottom of your lowest rib and the top of your hip bone. That is usually above the navel, not at it.
- Wrap the tape horizontally, snug but not compressing the skin.
- Breathe out normally and read the tape at the end of that breath. Do not hold your breath or pull your stomach in.
- Divide by your height in the same units. A 32-inch waist and a 68-inch height gives 0.47.
Two errors account for most bad readings: measuring at the navel, which on many adults sits well below the correct landmark, and measuring over a waistband. Both shift the result enough to move someone across a category.
What we had to retract
The claim that people with the highest waist-to-height ratios “lived 17 years fewer than average” came from a conference press release, not a peer-reviewed result. The published modeling is more modest. In a 2014 analysis in PLOS ONE using Health and Lifestyle Survey mortality data on 7,414 people, a 30-year-old man with a ratio of 0.7 was projected to lose about 7.2 years of life expectancy compared with one at 0.5, and a 30-year-old woman about 4.6 years.
Those figures are projections from a life-table model that assumes a person stays in the same category for life. They are not observed lifespans, and they are not a forecast for any individual.
The second retraction matters more. A tape measure does not prevent anything. Waist-to-height ratio is a screening measure that flags a pattern associated with higher risk in population studies. What happens next (whether risk changes at all) depends on clinical assessment and on things the number itself cannot deliver.
Where the measure is weak
The comparative evidence mostly uses cross-sectional risk factors as endpoints (blood pressure, lipids, glucose) rather than hard outcomes over decades. Fewer studies follow people to events, and those are the ones that would settle it.
A 2020 meta-analysis in Scientific Reports covering 32 studies found BMI identified excess body fat with a sensitivity of only about 50 percent in both sexes, and waist circumference around 57 to 62 percent. There were not enough data to pool waist-to-height ratio separately. The authors concluded that all of these tools have serious limitations as clinical screens, which is a fair summary of the whole field.
On ethnicity, the pooled boundary of 0.50 has held across the populations studied, and that is a genuine advantage over BMI, whose thresholds vary substantially between groups. But individual studies in Asian populations have reported optimal cut-offs somewhat below 0.5, and one 2014 analysis in Chinese adults found the ratio identified cardiometabolic risk in people whose BMI and waist circumference both looked normal. Treating 0.5 as a universal constant is a simplification that is useful rather than exact.
Older adults lose height through vertebral compression, which raises the ratio arithmetically without any change in the waist. Heavily trained athletes with substantial trunk musculature can cross 0.5 without excess adiposity, less often than they exceed BMI thresholds, but it happens. And the measure does not apply during pregnancy at all. For children, international cut-offs were only established recently, in a 2023 analysis in BMC Medicine.
What to do with the number
Treat it as one input among several, tracked over time rather than read once. A ratio that has drifted from 0.48 to 0.53 over three years is more informative than any single reading, and it moves for reasons a scale weight does not explain, which is why it is a more useful thing to watch than weight while the arithmetic of energy balance plays out slowly in the background.
If your ratio sits at 0.5 or above, that is a reason to mention it to a physician, particularly alongside blood pressure and a lipid and glucose panel. It is not a reason to start a restrictive diet, which the long-term trial evidence suggests will not hold anyway. Physical activity, resistance training and sleep all affect central fat, and activity has effects independent of weight change.
One thing this measure should not become is a daily ritual. It is a screening tool checked a couple of times a year. If measuring your body is something you find difficult to stop doing, or it comes with distress about eating, that is worth raising with a physician or registered dietitian.
Common questions
Is waist-to-height ratio better than BMI?
For screening central adiposity, yes, by a modest margin. The 2012 Obesity Reviews meta-analysis found it improved discrimination for cardiometabolic risk factors by 4 to 5 percent over BMI across about 300,000 adults. Both are crude, and NICE recommends using them together rather than choosing between them.
Where exactly do I put the tape?
Midway between the bottom of your lowest rib and the top of your hip bone, which is usually above the navel. Measure on bare skin, breathe out normally, and do not pull the tape tight. Measuring at the navel is the most common error and inflates the result.
Does the 0.5 cut-off apply to everyone?
NICE applies it across sexes and ethnicities for adults with a BMI below 35, and the systematic review evidence supports 0.50 as a reasonable global boundary. Some studies in Asian populations have found slightly lower optimal thresholds, so treat 0.5 as a useful round number rather than a precise switch.
My BMI is normal but my ratio is over 0.5. What does that mean?
It means you are in a group that BMI screening misses, and it is not rare: around 31 percent of adults in the healthy BMI range in the Health Survey for England analysis. It is a reason to have blood pressure, lipids and glucose checked, not a reason to panic.
Where this leaves it
Waist-to-height ratio is a cheap, quick screen that catches something BMI cannot see, using a tape measure and one division. It earns its place for that reason and no larger one. What it flags is worth a conversation with a clinician rather than a diet.
Greens Plus makes green superfood powders and bars, which are food and have no bearing on a measurement like this one; the ingredients are listed at greensplus.com.
About the Author