There is no evidence that healthy adults need eight glasses of water a day. The figure appears to be a misreading of a 1945 recommendation, and the largest direct measurement of human water use (5,604 people across 23 countries) found intake varying sixfold between individuals. This article covers where the rule came from, what the measurement data show, what counts toward intake, and the point at which drinking more becomes a hazard. It closes with water quality, and three claims this blog got wrong.
Where “eight glasses a day” came from
In 2002, Heinz Valtin, a kidney physiologist at Dartmouth, went looking for the source of the advice and published what he found in the American Journal of Physiology. He could not locate one peer-reviewed study supporting it.
The likeliest origin he identified was a 1945 recommendation from the Food and Nutrition Board of the National Research Council: roughly one milliliter of water per calorie of food, about 2 to 2.5 liters a day. The next sentence said most of that quantity is contained in prepared foods. That sentence got dropped, and the total became a drinking target.
The 2004 Dietary Reference Intakes set an adequate intake for total water of 3.7 liters a day for men and 2.7 for women. That covers all beverages and all food, roughly a fifth of it food, and it is a population median rather than an individual target.
What water turnover actually measured
Until recently nobody had measured human water use at scale. The 2022 study in Science by Yamada and colleagues did it with doubly labeled water: participants drink water tagged with stable isotopes of hydrogen and oxygen, and the differing rates at which the two labels leave the body give an objective turnover figure. The sample was 5,604 people from 23 countries, aged 8 days to 96 years.
Turnover peaked at 4.3 liters a day in men aged roughly 20 to 30, and 3.4 liters in women, holding flat from 20 to 55. Those are averages. The spread was the finding: the low end sat near 1 to 1.5 liters a day and the high end near 6, with outliers past 10. Age, body size and composition, physical activity, pregnancy, air temperature, humidity, altitude and country development index all moved it.
Two qualifications are easy to miss. Turnover is not a drinking target: the authors put intake from liquids and food at about 85 percent of turnover, with metabolic water and absorption through skin and lungs supplying the rest. And much of that intake is food. Their own conclusion was that one size does not fit all, and that the 8 × 8 figure is not backed by objective evidence.
Thirst, urine color, and the limits of this evidence
Thirst is not a lagging indicator that has already failed by the time it registers. Osmoreceptors in the hypothalamus respond to changes in plasma osmolality of one to two percent (before any measurable drop in performance) and drive both drinking and the release of vasopressin, which tells the kidney to concentrate urine. In a healthy adult with access to fluid, that system is self-correcting.
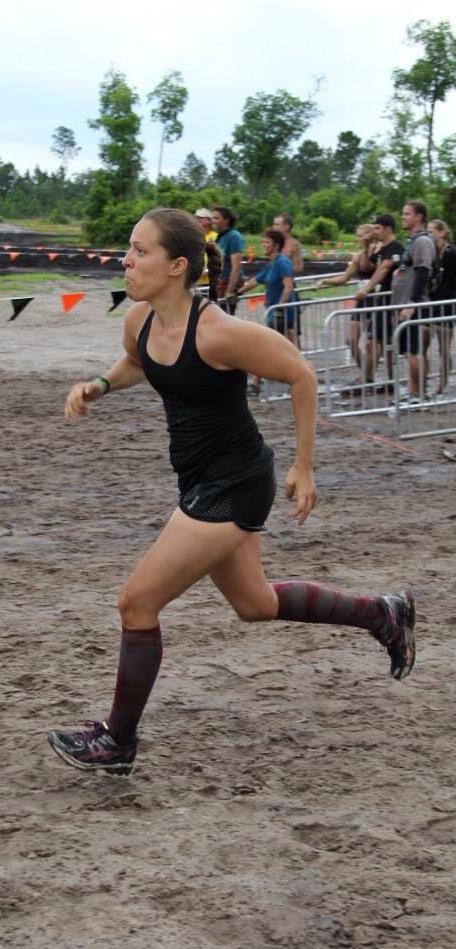
It is less reliable in two situations. Thirst sensitivity declines with age: a 1984 study in the New England Journal of Medicine compared seven healthy older men with seven younger men after 24 hours without water, and the older group reported markedly less thirst and drank less afterward. Fourteen people is a very small study; it has held up because larger work agreed. In hard exercise in heat, sweat losses can also outrun voluntary drinking, which is why endurance athletes plan intake rather than wait for a signal.
Urine color is a rougher check, and easy to fool. Eight-point color charts have tracked measured urine osmolality reasonably well in athletes under controlled conditions and much less well in older adults, whose concentrating ability declines. B vitamins, riboflavin especially, turn urine bright yellow regardless of hydration, and a large drink changes the color long before it changes body water.
The wider limitation deserves stating plainly. Almost none of this literature is randomized. No long trial has assigned people to different water intakes and followed health outcomes for decades, and observational studies linking hydration markers to aging cannot separate hydration from everything that travels with it. The evidence supports a range, and thirst as a guide inside it, not a number.
What counts toward intake
Water counts. So does everything else that is mostly water. Coffee and tea are included, and the idea that caffeine cancels them out does not survive testing.
In a 2014 crossover trial in PLOS ONE, 50 habitual male coffee drinkers took either four 200 mL coffees a day (about 4 mg/kg caffeine) or four 200 mL waters, three days each. Total body water was 51.5 kg on coffee and 51.4 kg on water; 24-hour urine volume was 2,409 mL against 2,428 mL. Urine specific gravity, osmolality and blood markers did not differ. Our overview of coffee and health covers the rest.
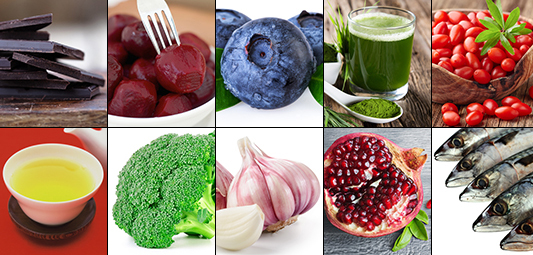
Food contributes more than most people assume. Cucumber, lettuce, tomatoes, melon and celery are over 90 percent water; yogurt, soup and oranges are close behind. A diet heavy in produce needs less from the tap.
Who is genuinely at risk, and who drinks too much
The groups for whom fluid intake is a real clinical concern are well defined: older adults, especially in residential care; young children with vomiting or diarrhea; people taking diuretics or SGLT2 inhibitors; people working or training hard in heat; and anyone whose kidneys or thirst signaling is affected by illness or medication. For them, planned intake beats waiting.
Drinking too much is not a theoretical risk either. Exercise-associated hyponatremia occurs when intake outpaces the kidney’s ability to excrete it and blood sodium falls. In a 2005 study in the New England Journal of Medicine, 488 Boston Marathon runners gave blood at the finish. Thirteen percent had sodium at or below 135 mmol/L, and 0.6 percent at or below 120 mmol/L, which is dangerous. The strongest predictors were gaining weight during the race (odds ratio 4.2, meaning they drank more than they lost) and a finish over four hours, odds ratio 7.4.
What did not predict it was whether runners drank water or sports drinks. Volume was the problem, not electrolyte content, the opposite of how this is usually sold. Our pieces on salt and sodium and physical activity cover the other sides of it.
US tap water, and when filtration makes sense
Public water systems in the United States fall under the Safe Drinking Water Act. The EPA sets enforceable National Primary Drinking Water Regulations for more than 90 contaminants in six categories: microorganisms, disinfectants, disinfection byproducts, inorganic and organic chemicals, and radionuclides. Total trihalomethanes, the main chlorination byproducts, carry a limit of 0.080 mg/L, and the lead action level drops to 0.010 mg/L on November 1, 2027 under the Lead and Copper Rule Improvements.
PFAS rules are in flux. The EPA set maximum contaminant levels of 4 parts per trillion for PFOA and PFOS in 2024, then in 2026 proposed rescinding the limits for PFHxS, PFNA, GenX chemicals and the hazard index, and pushing the PFOA and PFOS deadline from 2029 to 2031. Several states set their own.
The practical step is to read the Consumer Confidence Report your utility publishes each July. It lists what was detected and at what level. If lead service lines are possible, if the report shows something you would rather not drink, or if you are on a private well (which the EPA does not regulate), filtration becomes a reasoned decision rather than a default. Match the certification to the contaminant your report names: NSF/ANSI 53 for lead, cysts and specific chemicals, 58 for reverse osmosis, 401 for emerging contaminants. A filter certified for chlorine taste does nothing for lead.
Three claims we published that were wrong
The 2013 version of this article said 75 percent of Americans are chronically dehydrated, and that dehydration is the number one trigger of daytime fatigue. Neither figure traces to any survey or study we can find. We are withdrawing both.
It also recommended a branded “living water” purifier and warned readers off reverse osmosis, on the grounds that mineral-free water leaches essential minerals from internal organs. Water is not alive, and no study supports the leaching claim. Reverse osmosis does strip dissolved minerals along with contaminants, but drinking water supplies only a small share of most people’s calcium and magnesium.
“Structured” and “hexagonal” water fail on physics rather than nutrition. Liquid water does form hydrogen-bonded networks, but they are fleeting: work published in Nature in 2005 found the network loses memory of its previous arrangement within about 50 femtoseconds. Nothing a device does to water in a pitcher survives the trip to the glass.
Alkaline water is the same story with a different label. A 2026 review in Frontiers in Medicine found claims of systemic alkalinization unsupported by robust clinical evidence, and noted that blood pH in healthy people holds between roughly 7.35 and 7.45 regardless of what is drunk. Stomach acid sits near pH 2.
Common questions
How much water should I drink a day?
Enough that you are not thirsty and your urine is pale rather than dark. For most healthy adults in a temperate climate that lands between roughly 1.5 and 3 liters of fluid, with food supplying a fifth or so on top. Measured turnover across 5,604 people varied sixfold, so any prescribed number is wrong for most people following it.
Does coffee dehydrate you?
Not at ordinary intakes. In the 2014 PLOS ONE crossover trial, four coffees a day produced the same total body water and the same 24-hour urine volume as four glasses of water in 50 habitual drinkers. Very high doses in people who never consume caffeine do have a short-lived diuretic effect, which is a different situation.
Is bottled water safer than tap?
Not as a rule. Bottled water is regulated by the FDA as a food and tap water by the EPA, and the two standards are broadly comparable. Public systems publish annual test results; bottlers do not.
Do I need electrolytes in my water?
For most people on most days, no. A normal diet supplies far more sodium and potassium than a workout removes. Electrolyte replacement earns its place in prolonged endurance exercise, heavy sweating in heat, and illness with vomiting or diarrhea. Outside those it is flavored water.
Where this leaves the glass
Hydration is one of the few areas of nutrition where the body’s own regulation beats any rule written down. Drink when thirsty, drink more when it is hot or the work is hard, and read your utility’s annual report once, so any filter you buy solves a problem you actually have.
Water is mostly a vehicle for whatever goes in it. Greens Plus has been making green superfood blends since 1989.
About the Author